Heatmap
Heatmap
Welcome to our trading glossary! Today, we'll be breaking down the meaning of a key trading term - the heatmap. Whether you're new to trading or just want a refresher, our glossary aims to make trading jargon easier to understand. So, let's dive into understanding what a heatmap is in the context of trading.
Definition of a Heatmap
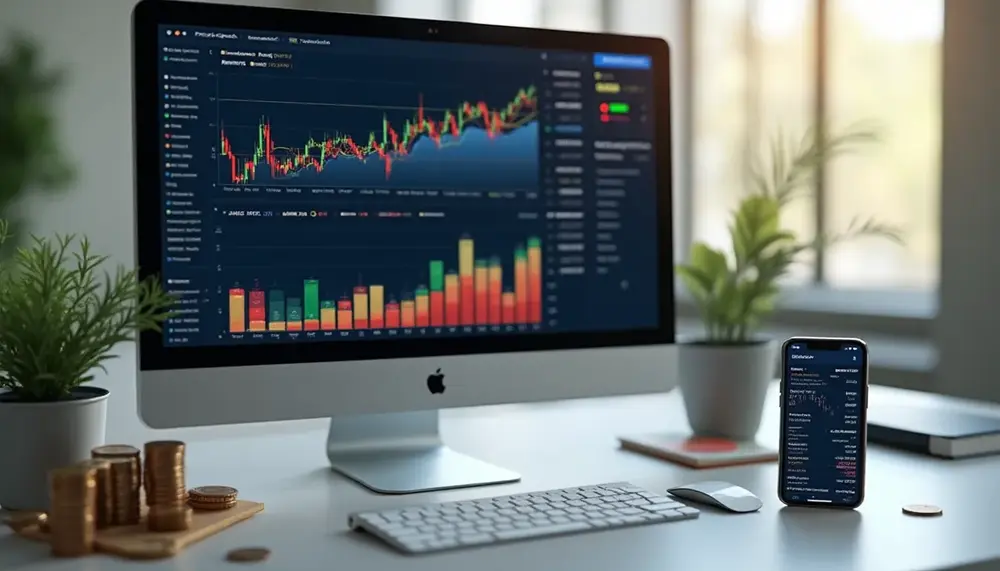
A heatmap is a visual representation tool used in trading. It uses color-coding to display a large amount of data in a compact form, helping traders to identify market trends and patterns quickly.
How Does a Heatmap Work?
Like a weather map uses different colors to show varying weather conditions, a heatmap in trading uses a spectrum of colors to show financial data. It's like seeing the market's heartbeat, relating different colors to indicate areas of high and low trading activity.
Why Use a Heatmap?
A heatmap gives traders an easy way to visualize complex data. It's an effective tool for identifying which stocks are performing well or poorly, offering a clear snapshot of market movements at a glance.
Reading a Heatmap
Reading a heatmap can initially seem complicated, but once you know how to interpret the color codes, it becomes a valuable tool for decision-making in trading. Typically, darker colors like red or purple represent lower values, while lighter colors like green or yellow represent higher values. However, color codes can vary between platforms, so always ensure to understand the specific map's color scale.
Heatmaps in Different Trading Scenarios
Heatmaps are versatile and can be used in various trading scenarios. Whether it's identifying trends in forex, highlighting the best performing sectors in the stock market, or mapping cryptocurrency volatility - the heatmap is a reliable partner for traders.
In summary, a heatmap is a powerful tool that helps traders see the big picture quickly. Its color-coded, sorted data allows traders to interpret market trends directly and intuitively, facilitating more informed trading decisions.
Blog Posts with the term: Heatmap

Crypto wallet detector tools offer multi-standard address validation, real-time monitoring, scam detection, and portfolio management to ensure secure and efficient crypto transactions....

Wallet visualizer tools turn complex crypto portfolios into clear, interactive visuals, making it easy to track assets, spot risks and opportunities, and streamline decision-making. With features like real-time updates, multi-chain integration, heatmaps, and export options, they help users manage diversified...
